The median the market implied over time and its middle half (the band), read from every strike's prices on ForecastEx.
Every outcome
Outcome
Last odds
Day
Bid
Ask
Pays
Contracts
✓ Above 7,450
28%
✓ Above 7,475
28%
✓ Above 7,500
28%
✓ Above 7,525
28%
✓ Above 7,550
28%
✓ Above 7,575
28%
✓ Above 7,600
28%
✓ Above 7,625
28%
✓ Above 7,650
28%
✓ Above 7,675
28%
✓ Above 7,700
28%
1.00
✓ Above 7,725
28%
103
✓ Above 7,750
28%
2.0K
✓ Above 7,775
28%
2.1K
✓ Above 7,800
28%
6.2K
✗ Above 7,825
12%
337
✗ Above 7,850
<1%
✗ Above 7,875
<1%
✗ Above 7,900
<1%
✗ Above 7,925
<1%
✗ Above 7,950
<1%
✗ Above 7,975
<1%
✗ Above 8,000
<1%
✗ Above 8,025
<1%
✗ Above 8,050
<1%
✗ Above 8,075
<1%
"Pays" is what a $1 stake returns if that outcome happens, at the price shown (before any fees). Bid and ask are the best prices to sell and buy "Yes".
The top-performing S&P 500 stocks YTD have shed almost 7% on averageSeeking Alpha · 6 h agoSeeking Alpha The 20 best performing stocks in the S&P 500 (SP500) year-to-date through September are down an average of 6.9% on Thursday. All the following stocks—aside from Palo Alto (PANW), which ended 2.2%—closed in the red. Moderna…
Midday Pulse: S&P 500 top intraday losersSeeking Alpha · 10 h agoHere's a quick look at the stocks seeing the steepest intraday declines across the S&P 500 (SP500) on Thursday. ozgurdonmaz/E+ via Getty Images Here's a quick look at the stocks seeing the steepest intraday declines across the S&P 500…
Dow Adds 12, Nasdaq Tumbles 694, S&P 500 Falls 94TV News Check · 6 h agoSharp drops for AI stocks overwhelmed markets worldwide Thursday as oil prices jumped. The S&P 500 fell 1.2% for its worst day since July, while the Nasdaq composite tumbled 2.6%. The weakness for tech stocks was so overwhelming that it…
GPIX Vs. SPYI: Which S&P 500 Income ETF Wins Into 2027Seeking Alpha · 6 h agoThe Goldman Sachs S&P 500 Premium Income ETF and NEOS S&P 500 High Income ETF offer distinct income and growth profiles via varied strategies. Click for more. The last few weeks have been rough, as the market lost its upward steam. It…
S&P 500: Junk Bonds Worry Me More Than AI HyperscalersSeeking Alpha · 6 h agoInvestment-grade corporate bond yields have surged to decade highs, signaling broader market concerns beyond just AI hyperscalers. Click to read this analysis. - AI hyperscalers like Oracle face record CDS widening, reflecting rising…
Bitcoin Drops by 4% as S&P 500 Retreats on Equities SelloffsMarketForces Africa · 4 h agoBitcoin (BTC) fell 4.13% to $81,162 on Thursday, underperforming a broadly weaker crypto market driven mainly by a macro-led sell-off. The move reflects macro-driven risk aversion, as Bitcoin sold off alongside traditional markets ahead of…
Prediction: Broadcom Stock Could Crush the S&P 500 Through 203024/7 Wall St. · 10 h agoBroadcom's AI revenue is exploding and Wall Street analysts are nearly unanimous in their bullish stance, yet the stock sits in the red for the year while the S&P 500 surges. Something has to give, and the path to $700… Broadcom…
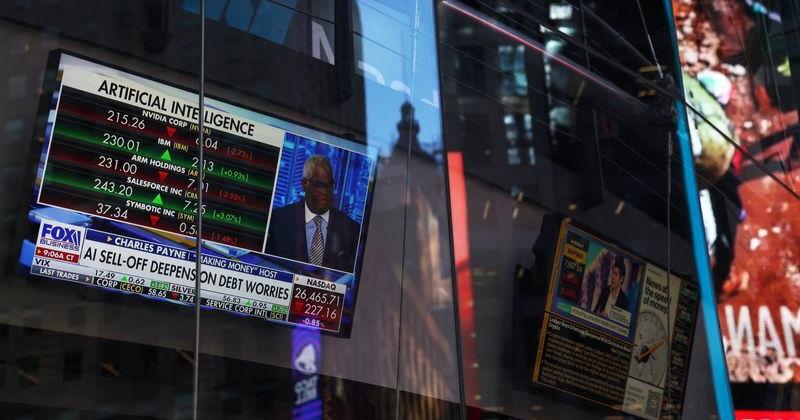
S&P 500, Nasdaq end sharply lower as revived AI doubts ignite tech selloffCentral Oregon Daily · 6 h agoA screen displays trading information outside the Nasdaq Market site in New York City, US, October 15, 2026. REUTERS/Shannon Stapleton By Stephen Culp and Tharuniyaa Lakshmi NEW YORK, Oct 22 (Reuters) - US stocks tumbled on Thursday and…
3 Vanguard ETFs Pay Up to 3.71%, and One Is Beating the S&P 50024/7 Wall St. · 3 h agoThree Vanguard ETFs offer yields as high as 3.71%, but their total returns over the past year tell very different stories about which one actually rewarded patient investors and which quietly destroyed wealth despite steady payouts. The…
Stock Market Today: S&P 500, Nasdaq Fall After Tesla and Meta EarningsCoinpaper · 11 h agoThe S&P 500, Nasdaq and Dow Jones open lower on October 22 as investors digest Tesla and Meta earnings, rising oil prices and renewed AI spending concerns. U.S. stocks opened lower on Thursday, October 22, as disappointing reactions to…
Odds are traders' prices on Kalshi, Polymarket, ForecastEx and Crypto.com, not forecasts by 4Search. Prices read from the venues 3 min ago. Prices may be delayed. Money traded on Kalshi and ForecastEx is estimated from contracts. Not betting or investment advice.
Prediction-market prices are what traders pay for each outcome on Kalshi, Polymarket, ForecastEx and Crypto.com, read as the market's implied chance. They are not forecasts by 4Search, can move fast and can be wrong; they are read every few minutes and may be delayed. Money traded on Kalshi and ForecastEx is estimated from contracts at their price. News comes from the 4Search index; prices of stocks, rates and coins from 4Search Finance. Nothing here is betting, financial or investment advice. Terms of use.