Install
Berkeley, CA 94709 Weather
Current conditions
Observed at Berkeley Lab · 28 min ago
Forecast
10-day-
Wednesday
A chance of rain showers after 11am. Mostly cloudy. High near 65, with temperatures falling to around 63 in the afternoon. South southwest wind around 2 mph. Chance of precipitation is 30%. New rainfall amounts less than a tenth of an inch possible.
-
Wednesday Night
A chance of rain showers. Mostly cloudy, with a low around 57. Southwest wind around 2 mph. Chance of precipitation is 40%. New rainfall amounts less than a tenth of an inch possible.
-
Thursday
A chance of rain showers before 4pm. Mostly cloudy, with a high near 61. Southwest wind 2 to 6 mph. Chance of precipitation is 40%. New rainfall amounts less than a tenth of an inch possible.
National Weather Service forecast updated 5 hrs ago.
Hourly
Hourly forecast- Now58°
- 7 AM58°
- 8 AM58°
- 9 AM58°
- 10 AM59°
- 11 AM61°17%
- 12 PM62°17%
- 1 PM63°15%
- 2 PM64°16%
- 3 PM63°19%
- 4 PM63°26%
- 5 PM63°34%
- 6 PM62°43%
- 7 PM61°36%
- 8 PM61°31%
- 9 PM60°37%
- 10 PM60°35%
- 11 PM60°20%
- Thu12 AM59°28%
- 1 AM59°38%
- 2 AM58°41%
- 3 AM58°20%
- 4 AM58°34%
- 5 AM58°40%
10-day forecast
Details- TonightOct 20Mostly Cloudy56°
- TodayOct 21Chance Rain Showers43%57°65°
- ThuOct 22Chance Rain Showers39%53°61°
- FriOct 23Mostly Sunny51°66°
- SatOct 24Sunny50°69°
- SunOct 25Mostly Sunny54°71°
- MonOct 26Mostly Sunny54°70°
- TueOct 27Mostly Sunny69°
- WedOct 28Partly cloudy48°70°
- ThuOct 29Cloudy48°72°
Days after the National Weather Service's seven are MET Norway's outlook, a computer model with no forecaster's review.
Radar
Full mapWeather news near Berkeley
More weather news-
 California's rainy season to arrive with flood threat, tornado risk and Sierra snow
California's wet season is starting off with a bang. The first significant storm of the season is forecast to bring heavy rain to vulnerable burn scars near Big Sur, coastal tornado risk to the Los Angeles area, and a…
-
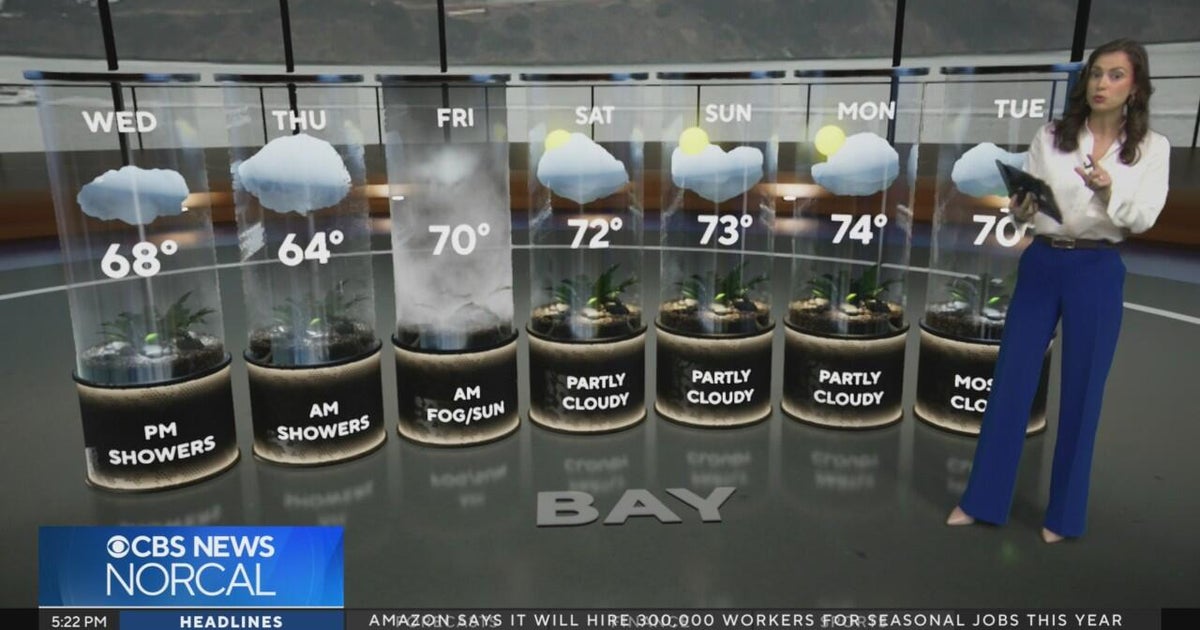 Tuesday evening First Alert weather forecast - 10/20/26
CBS News Tuesday evening First Alert weather forecast - 10/20/26 Becerra, Hilton campaign for California governor in Bay Area 2 weeks out from Election Day Oakland considers raising nuisance property fines to $10,000 a…
-
 Bay Area could see its most rain since May. Here's how much to expect
The Bay Area will soon see its first legitimate rain chance of the season, but the window for wet weather is trending later and weaker than previously indicated. Rain is not expected to begin until Wednesday morning at…
- These Are the States With the Best Weather Year-round
California and Hawaii are strong contenders for the best weather in the U.S. year-round. Coastal California offers comfortable temperatures with limited seasonal swings; Hawaii delivers consistent coastal warmth. But…
-
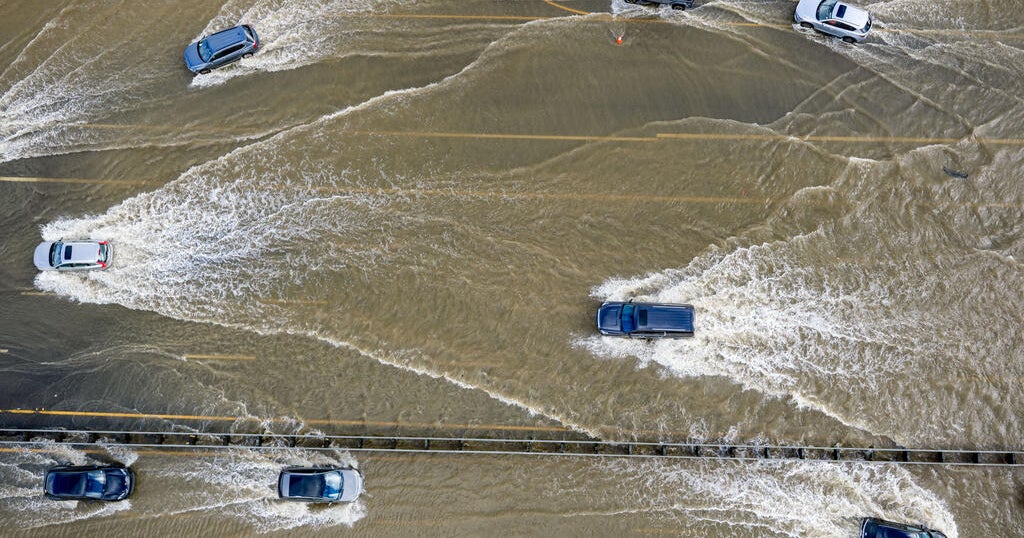 Conditions aligning for Bay Area to expect highest King Tides in 18 years
October 18, 2026 / 1:21 PM PDT / CBS San Francisco King tides bring coastal flooding to the Bay Area every winter. But this fall and winter, the region is expected to see the highest tides in 18 years. Why does this…
-
 ‘Danger zone’: These 5 US states are about to be hit hardest by El Niño, experts warn
Expect wildfires, floods and storms The world is entering a “danger zone of extreme weather” as the El Niño weather phenomenon starts to be felt, UN chief António Guterres recently said. His warnings have been echoed by…
- San Francisco Warms Friday Before Bay Area Temps Tank
The forecast calls for offshore flow and no rain in San Francisco. A Red Flag Warning remains in effect until 11 a.m. Friday for the North Bay Interior Mountains, while very dry conditions and elevated fire danger are…
-
 Back to reality, much cooler this weekend
KPTV We ended up much cooler this morning than originally thought but ample sunshine and a very light east wind should help push temperatures into the mid to upper 70s. FEW SHOWERS + COOLER THIS WEEKEND Hopefully you’ve…
- Bay Area beaches to see sneaker waves, strong rip currents this weekend
The National Weather Service is warning beachgoers about dangerous wave conditions this weekend. Here, a person watches a huge swell at Montara State Beach in December 2020. On what could be one of the Bay Area’s last…
-
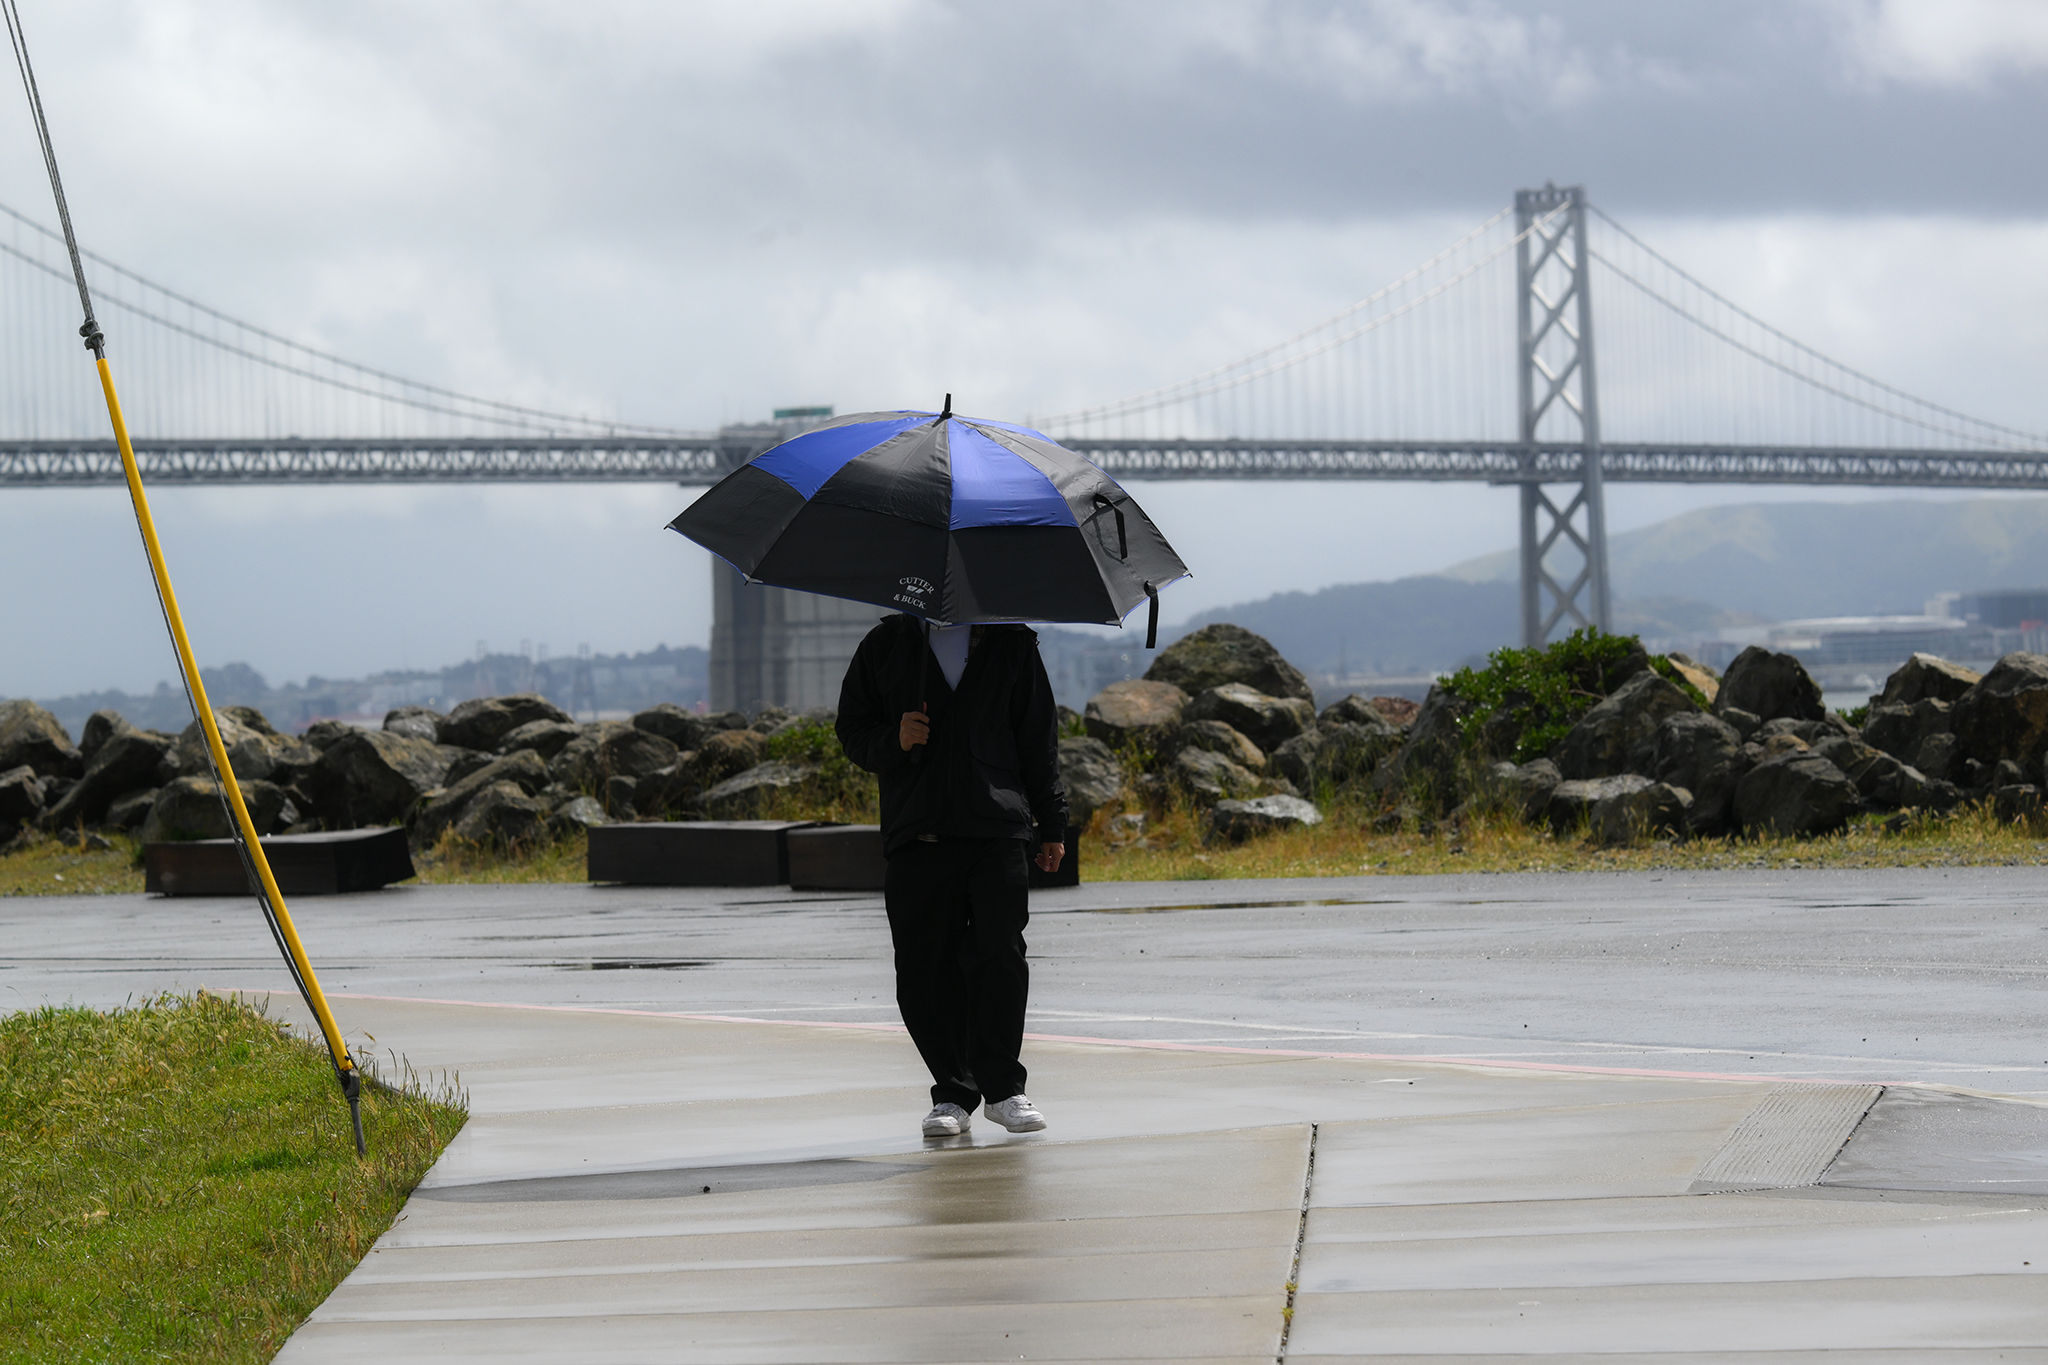 Warm, wet winter in store for California. Here's what to know.
A pedestrian on Treasure Island braces against rainy weather on April 12, 2026. Winter is coming, and it looks warm and wet in California, according to new data. Huge clouds over the city as seen from Treasure Island…
Air quality
Acceptable. Unusually sensitive people should consider limiting prolonged outdoor exertion.
Forecast
- WedGood (50)
- ThuGood
- FriGood
Oakland, CA reporting area · 1 hr ago. Data from AirNow (EPA and its state, local and tribal partners); preliminary and subject to change.
Sun & moon
Almanac
MonthlySan Francisco Airport Area, records since 1945. Normals 1991–2020. Data from NOAA's Regional Climate Centers (ACIS).
Nearby
Forecasters' discussion
From the National Weather Service office in MTR, issued 1 hr ago
Key Messages
Updated at 801 PM PDT Tue Oct 20 2026
- Cooling trend continues through the end of the week
- Beneficial light rain showers expected Wednesday through Thursday
- Thunderstorms possible Wednesday afternoon into Thursday morning across Central Coast
- Warm and dry next weekend
Short Term
Issued at 1230 AM PDT Wed Oct 21 2026 (Today and tonight)
The center of the 500 mb cut-low is inching closer to the coast as the sub-tropical jet stream supports the left portion of the system, bringing enhanced momentum and moisture flux. This is where the most instability and lift can be found. As of 11:30 PM PDT, KMUX radar is picking up on a few cells offshore exhibiting a ~10-25% chance of lightning with a few lightning strikes observed along the occluded front (~250-300 miles SW from Monterey). The current offshore activity is foreshadowing what is to come early Wednesday morning.
The first few rain bands are expected to make their way over the Central Coast just before sunrise. Going into the afternoon, precipitation gets wrapped around the system's center and eventually spreads through the rest of the Bay Area. Precipitable water is expected to rise above the 90th percentile for this time of year, which prompted WPC to include the southern Central Coast in a marginal risk of excessive rainfall for Wednesday.
To further assess the potential for severe thunderstorms, three high- resolution model soundings were analyzed: the 3km NAM, 10km RDPS, and the RRFS. Keep in mind that the NAM tends to be the most pessimistic model out of the three in terms of moisture. Upon evaluation of the near-storm environment for each, there are a few inconsistencies across the models in terms of the severe thunderstorm threat and whether the environment is conducive to tornado spin-ups.
Before getting into what *is* consistent across the models, let's run through a quick overview of a couple notable stability indices: the Total-Totals and K index. The Total-Totals index measures atmospheric instability by taking the thermal difference between 850 to 500 mb to identify the potential for severe thunderstorms or tornadoes. The K index is used to assess atmospheric buoyancy by measuring the low to mid-level moisture as well as the 850-500 mb thermal difference. The greater the K index value, the greater the potential is for widespread thunderstorms (K > 20 = scattered thunderstorms, K > 35 = numerous thunderstorms). Similarly, higher Total-Totals (TT) index values indicate an enhanced potential for severe thunderstorms and/or tornadoes (TT > 48 = severe thunderstorms, TT > 50 = tornadoes).
Why am I talking about stability indices? Well, according to these indices and other environmental parameters, the three high-res model soundings that were analyzed all indicate a heightened risk for at least scattered, severe thunderstorms along the Big Sur coastline. The NAM estimates TT ~ 56 and a K index ~ 36, RDPS estimates TT ~ 54 and a K index ~ 30, and RRFS estimates TT ~ 50 and K index ~ 31.
Long Term
Issued at 1230 AM PDT Wed Oct 21 2026 (Thursday through Tuesday)
The rain and thunderstorm threat are gone by Friday. With the trough to our east, building high pressure brings warm and dry conditions into early next week. Euro and GFS ensemble members suggest warming to near seasonal averages meanwhile precipitable water values are forecast to dip below the 25th percentile. Monday onward, there is a great deal of uncertainty on when the weak ridge breaks down. An energetic Central Pacific plus the most recent 6-10 day Climate Prediction Center precipitation outlook suggests another trough coming our way with the potential for more rain.
Aviation
(12Z TAFS) Issued at 418 AM PDT Wed Oct 21 2026
Shower activity is picking up across the marine environment with increasing confidence in thunderstorm development along the Central Coast. Thunderstorm potential increases for MRY and SNS by late morning as the bulk of the convective activity moves onshore. Highest confidence in thunderstorms impacting MRY/SNS but if the HRRR is correct thunderstorm activity may move into the Bay Area by early this afternoon as the main line moves through. Moderate to at times heavy rain is likely with the first round of showers across the Central Coast starting around 17Z. It will spread slightly slower into the Bay Area (reaching it around ~20-03Z) with recent guidance slowing down the arrival of rain even further. Confidence remains low in the overall wind forecast given the close proximity of the low offshore. Winds will likely stay variable for much of today but we may see periods of stronger, erratic winds particularly if a thunderstorm is able to develop. Expect temporary reductions in visibility and ceiling heights as stronger showers move through. Showers may become more scattered overnight Wednesday into Thursday but the prevailing trend will be for showers to continue through the end of the TAF period.
Vicinity of SFO...Showers will reach SFO by late morning/early afternoon with temporary reductions in visibility and ceiling heights likely as stronger showers impact the airport. A low potential for thunderstorms continues through the day with confidence too low to include TS in TAF as of this moment. This may change as convective activity to our south gets within range of KMUX and we get a better idea of how robust thunderstorm activity will be today. If thunderstorms do reach SFO it would likely be between 18 to 00Z as the main convective region moves through. Confidence in wind directions remains low due to the close proximity of the low.
SFO Bridge Approach...Similar to SFO.
Monterey Bay Terminals...Increasing confidence in thunderstorms impacting MRY and SNS this morning/afternoon as showers move in. Thunderstorms will result in erratic winds and reductions in visibility/ceiling heights below what is currently in the TAF. The timing of rain arrival to MRY/SNS remains on track with guidance suggesting the arrival of rain/thunderstorms may be speeding up. The bulk of the convection is currently to the south of Point Piedras Blancas but will reach the Monterey Bay region within the next few hours. The heaviest showers are likely this morning but lighter, at times more scattered, showers will prevail through the end of the TAF period.
Forecasts, observations and alerts in the United States come from the National Weather Service (NOAA); radar from NOAA's Multi-Radar Multi-Sensor system; satellite imagery from NASA's Global Imagery Browse Services (GIBS) and NOAA's GOES satellites; the map from the U.S. Geological Survey's National Map; air quality from AirNow (EPA and its partners); hurricane information from the National Hurricane Center; climate normals and records from NOAA's Regional Climate Centers (ACIS). Forecasts outside the United States and the UV index: MET Norway (CC BY 4.0); observations outside the U.S.: airport reports via NOAA's Aviation Weather Center. Place names: GeoNames (CC BY 4.0). Data are copied on a schedule and may lag the sources; for warnings that affect your safety, follow your local National Weather Service office and emergency officials. Weather news is drawn from the 4Search index and reflects what the press published. Terms of use.